How we built the GIS Shapefile Online Viewing & Editing functionality of SGMA Solutions. When developing SGMA Solutions, we found requirements for SGMA compliance that would require a bit of software tinkering. One module we developed supported viewing and editing compressed GIS Shapefiles online. Groundwater Sustainability Agencies (GSAs) had to establish the basin boundaries that they will be managing. After reviewing many of the public submissions, we found there was not a standard way of mapping these boundaries. Some GSAs submitted shapefiles, some with a printed map in a PDF. A path which could lead to basin boundary overlap, a troubling situation.
The Sustainable Groundwater Management Act is in full effect to provide a framework for long-term groundwater management across all of California and any delay is bad for the rest of us. To combat this situation, we had to present available basin data to users and allow them to see information about each basin and provide tools to map their basin. Our goal is to have an up to date “official” unofficial map of all basins and deal with conflicts as they come. Right now the DWR intends to publish an official GSA list and related shapefiles every year after all submitted GSAs are curate and approved.
In order to combat this problem, we needed a way to reliably translate the official posted GIS shapefile onto the web and allow seamless edits. After the user has finished editing, a new shapefile would need to be created on the fly.

Shapefiles are typically compressed in a .ZIP file and is the preferred format for passing along vector GIS data for use in many Desktop applications. In order to present GIS data on the web, we had to read this data in a web-friendly format, which came in the form of GeoJSON with the condition that no pre-processing on the shapefile would take place. The application would need to be able to map one or more shapefiles without any perquisites. This would allow the application to present any data with minor adjustments, all we had to do was load the compressed shapefile. With a few tweaks to the awesome open source projects from Esri and a bit of elbow glue, we were able to do just that and use our GIS Shapefile Web Editor to show different types of water data in a dashboard.
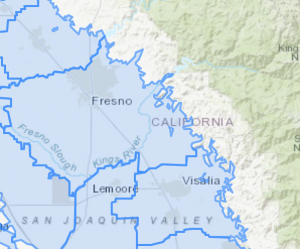
Below is the online editor in action. A user draws their basin boundary against published data, and a shapefile with the new additions is downloaded for the user to use anywhere.
I plan to break that code into a more general service for others to use. Stay tuned!