


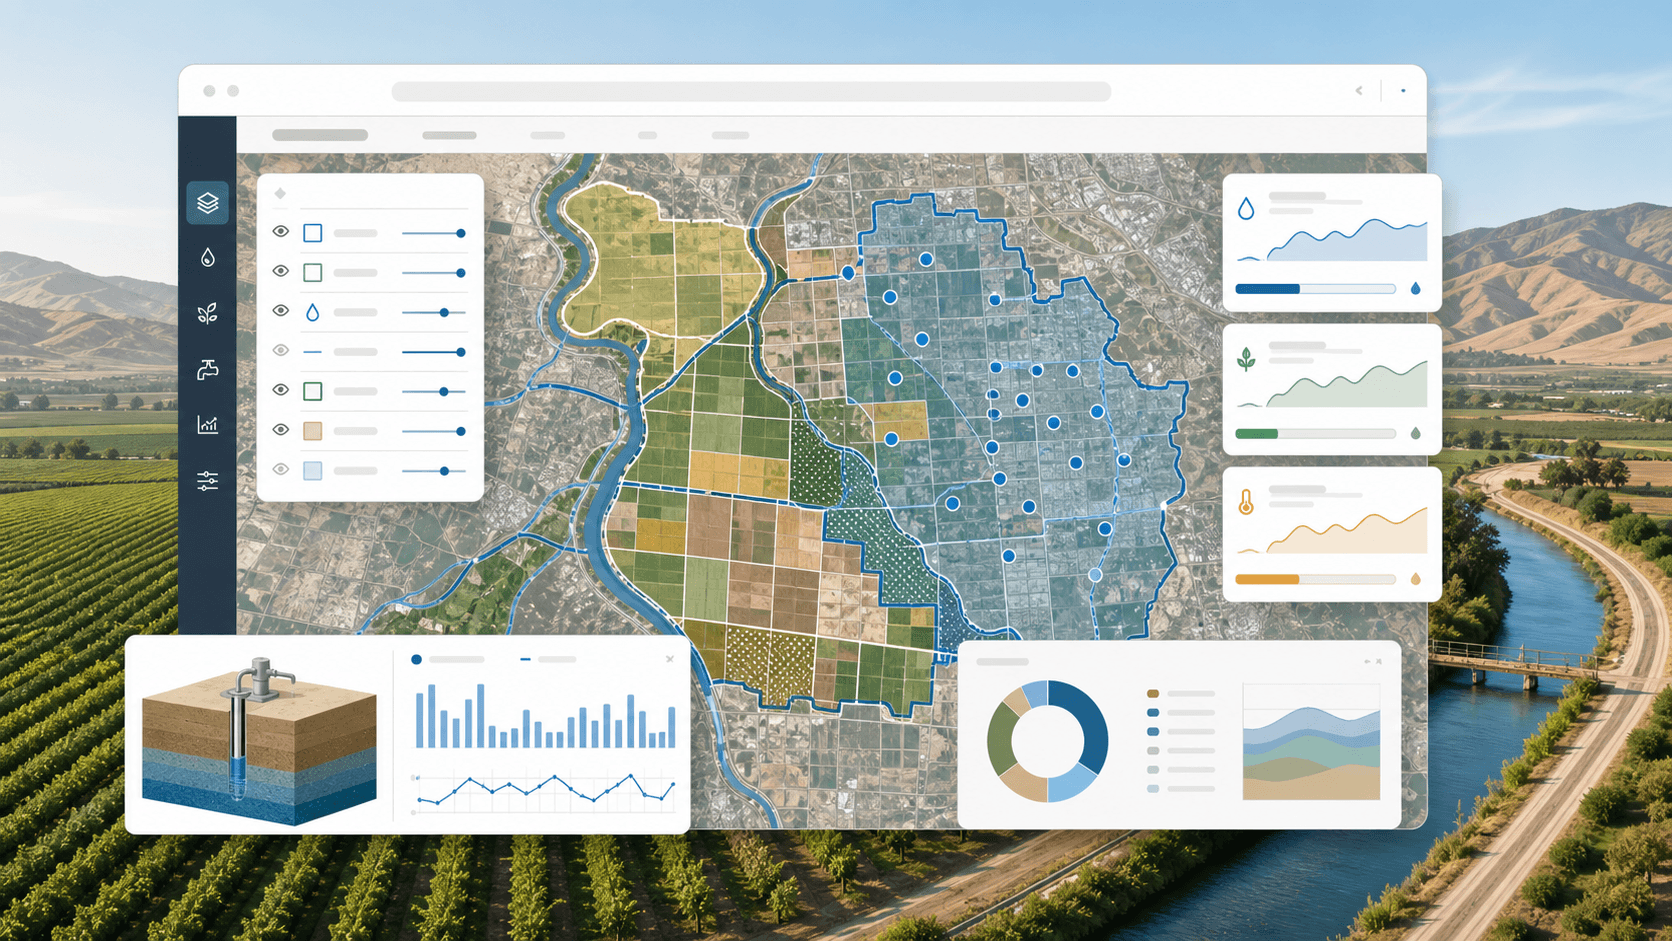
California water and agriculture teams depend on geographic data. Boundaries, parcels, wells, groundwater areas, service zones, irrigation districts, and reporting regions all have spatial meaning.
The challenge is that GIS data often lives in specialized desktop tools, spreadsheets, shapefiles, PDFs, and staff knowledge. That makes collaboration harder than it needs to be.
Web-based GIS and data tools can make the work more accessible without replacing professional GIS systems.
The workflow problem
Many teams need to answer practical questions:
- Which parcels are inside this boundary?
- Which landowners are affected?
- Which wells belong to this area?
- What changed since the last reporting period?
- Can non-GIS staff review a map?
- Can field or office teams update data safely?
If the answer requires one specialist to manually export screenshots or manipulate files, the workflow becomes a bottleneck.
Web GIS is useful when access matters
Desktop GIS is powerful. Web GIS is useful when more people need controlled access.
A web tool can help staff:
- View boundaries in a browser
- Upload shapefiles
- Search parcels
- Attach notes or records
- Filter by status
- Export reports
- Share a map with stakeholders
The goal is not to replace expert analysis. It is to make common review and reporting tasks easier.
Shapefiles are still everywhere
Even with newer formats available, shapefiles continue to show up in government, agriculture, engineering, and land management workflows. A practical tool often needs to support them.
A good upload flow should:
- Accept zipped shapefiles
- Validate required files
- Parse geometry safely
- Store metadata
- Show the result on a map
- Warn users about projection or geometry issues
That validation step matters. Bad spatial data can quietly create bad decisions.
Data modeling matters as much as the map
The map is only one layer. The data model behind it determines whether the tool is useful.
You may need to represent:
- Parcels
- Owners
- Agencies
- Water districts
- Wells
- Boundaries
- Reporting periods
- Documents
- Notes
- Status history
Once those relationships are clear, the map becomes an interface to operational data, not just a visual layer.
Reporting is where value shows up
For many teams, the most valuable output is not the map itself. It is the report generated from mapped data.
Examples:
- Acreage by boundary
- Parcel lists by status
- Owner contact exports
- Compliance summaries
- Change reports
- Field review packets
When a GIS tool can produce these outputs reliably, it becomes part of the operations workflow.
Build for staff reality
The best local government and agriculture tools respect the way teams actually work. That means:
- Simple upload flows
- Clear validation messages
- Exports to familiar formats
- Permission levels
- Audit history
- Good printing or PDF support
- Fast search
The software should reduce dependence on one person manually assembling information.
A practical path forward
Start with one spatial workflow that causes repeated friction. Build a browser-based tool around that workflow. Integrate the data model, map view, validation rules, and exports.
That is often more valuable than trying to build a complete GIS platform. Focused tools win when they make a real operational process easier.